
Want to learn Tử Vi? How to start with Nhật Nguyệt
Learning Tử Vi on Nhật Nguyệt works best as two things side by side: build your own chart, then read through the knowledge map, four levels from basics to application. With a chart in front of you, every article has somewhere to point.
First: build your own chart
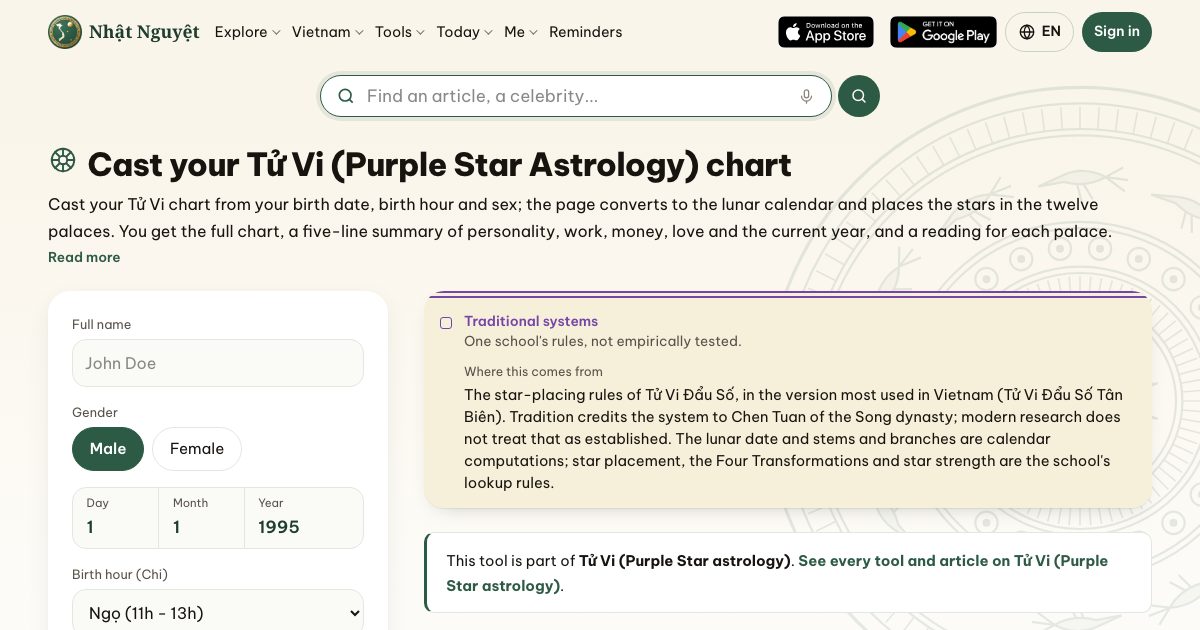
Choose your gender (1), enter your birth date in the solar calendar (2), pick your birth hour (3), then press the button below the form (4). The chart shows all twelve palaces, the fourteen main stars and the Four Transformations, with a calculation section so you can check each step. The birth hour matters most: one double-hour off gives a different chart.
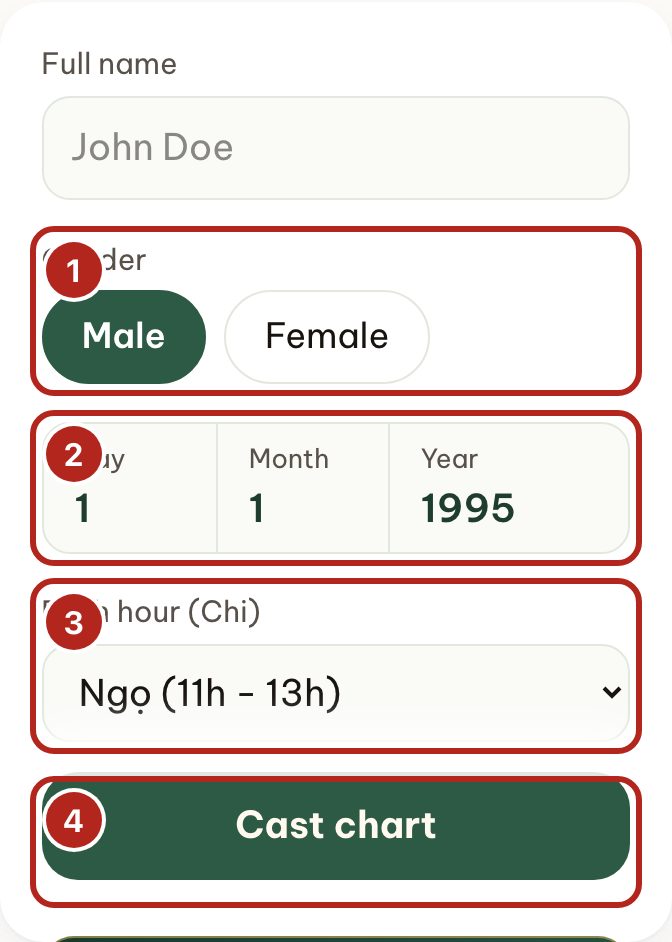
The chart is computed by the machine exactly by the star-placement rules of the school in use. The machine only guarantees that the rules were applied correctly; whether those rules say anything true about a life has not been tested.
Level 1: basics
- What is Tử Vi? An overview and the basic concepts
- What the Complete Book of Tử Vi Đẩu Số is and who compiled it
- The first three lines of a chart: yin-yang and gender, element pattern, nạp âm
- The schools of Tử Vi, and why one chart reads differently
- Is Tử Vi science or superstition?
Level 2: the parts of a chart
- The fourteen main stars and two main stars in one palace
- The Life palace, then the other eleven in turn
- Star strength: temple, prosperous, gaining, neutral, fallen and Tuần and Triệt
- The Four Transformations, starting with Hoá Lộc
Level 3: reading techniques
- The three directions and four squares
- A Life palace with no main star
- Chart patterns in diagrams: 16 classic patterns
- Ten-year periods, yearly periods and flowing stars
To see how the palaces connect through the Four Transformations, open the connected-palaces tool.
Level 4: application
The whole Tử Vi tree, including branches still being written, is on the knowledge map.
When you want one continuous reading
Reading articles teaches you how to read a chart. To see those rules put together into one reading for your own chart, look at a sample reading.